Back to the LLPOA Water Monitoring Page
Download as [pdf] file
View original data sheets
Loon Lake Property Owners Association Citizen Water
Quality Monitoring
2011 Summary
Report
Prepared by
Jim Davies May 6, 2012
This
is the fifth year of the Loon Lake Property Owners’ lake water quality
monitoring program. Once again I must
remind all who read this that although another year of data gathered does
permit general comparisons to the previous years, scientific methodology
insists that many observations over several years must be made before
definitive conclusions can be made about water quality trends.
Notwithstanding
the above, there is little room left for skepticism regarding the extent to
which Loon Lake’s water quality is deteriorating, how long term or short term
it may be, how much of it is man made, and what if anything we can or should do
about it. The data is becoming
increasingly convincing. Loon Lake water quality has been and is deteriorating.
It becomes apparent when historical data is compared to the newer data that
became available from our five years of water column studies. These results
show that in the middle to late summer below 15 meters depth there is
insufficient dissolved oxygen to sustain healthy, deep/cold water Kokanee and
Mackinaw fishery. The data validates studies for the Washington Department of Fish and Wildlife
that point to an anoxic hypolimnion limiting Loon Lake salmonid habitat (Scholz
et al, 1988, McClellan et al, 2005).
Note: Detailed original data, original field notes
including conditions and volunteer staff present are not included in this report. If you need this information please contact
J. Davies at 233-2651 or the Loon Lake Property Owners Association – Water Quality
Monitoring Project Leader.
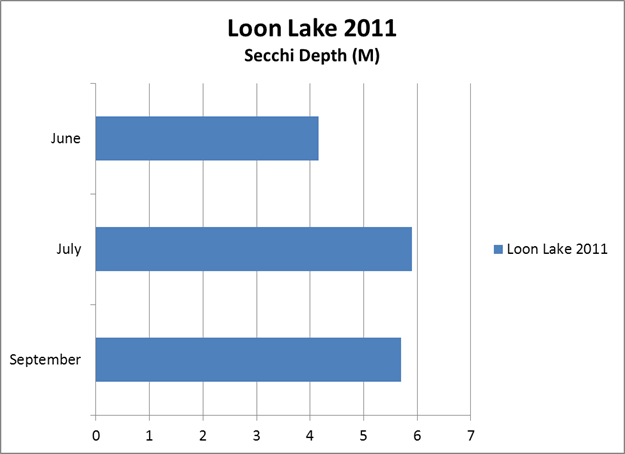
WATER
CLARITY: The clarity of the lake’s water
is measured by submerging a Secchi disk until it disappears. In 1985 the Fisheries study conducted for the
Department of Fish and Wildlife) by EWU reported a summer average of 6.5 meters
(21 feet). The 2007 Secchi disk
measurements averaged very close to those 1985 averages, (6.1 meters - 20 feet).
The 2008 measurements averaged 6.8 meters (22.1 feet). The 2009 measurements
averaged 6.95 meters (22.6 feet). 2010
measurements averaged 6.2 meters (20.2 feet).
2011 averaged 5.3 meters (17.4 feet).
Figure 1. Loon Lake Secchi disk clarity
Note: The Lake is also measured from top to bottom
for temperature, dissolved oxygen, pH and conductivity with our Hydrolab Data
Sonde. This instrument is calibrated
before and after each use. It is stored
and cared for by LLPOA/LLDF citizen volunteers that have been trained for its
use, storage and maintenance.
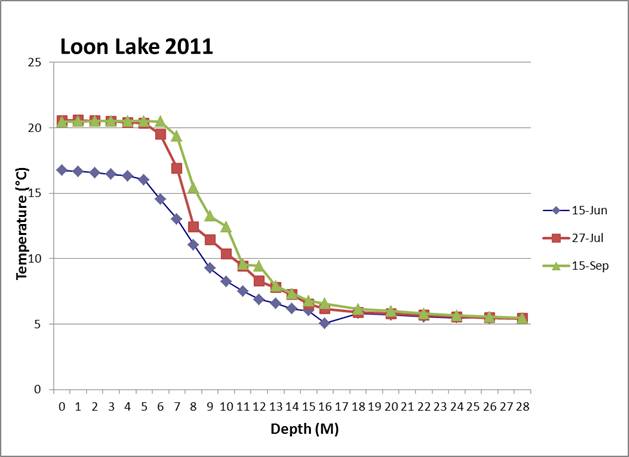
TEMPERATURE: The temperature measured over depth for each
field trip is shown in Figure 2. It
clearly shows the typical summer stratification. The profile shows an epilimnion (top warmer
layer), the metalimnion (middle layer where temperature drops relatively
quickly with depth), and the hypolimnion (bottom layer, which is cold).
Figure 2. Loon Lake Water Column
Temperature profiles
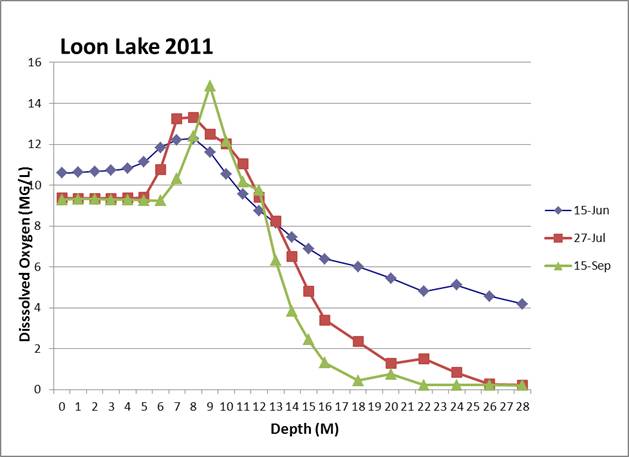
DISSOLVED OXYGEN: When the lake
is thermally stratified, the bottom layer cannot reoxygenate by mixing with the
upper layer. The bacteria
responsible for the decay use up almost all the oxygen in the hypolimnion. Figure 3 shows that there is plenty of oxygen
in the upper part of the water column but later in the summer the dissolved
oxygen goes to less than four milligrams per liter (mg/L) below approximately
15 meters. At this concentration of
dissolved oxygen, fish cannot survive for long and phosphorus starts to be
released from the sediments. The dissolved
oxygen levels found in 2011 below 15 meters in Loon Lake are not good, but
similar to those found in previous years.
Figure
3: Loon Lake Dissolved Oxygen Profiles –
Note: Dissolved Oxygen is shown in
milligrams per liter (mg/L). A milligram
is one one thousandths of a gram.
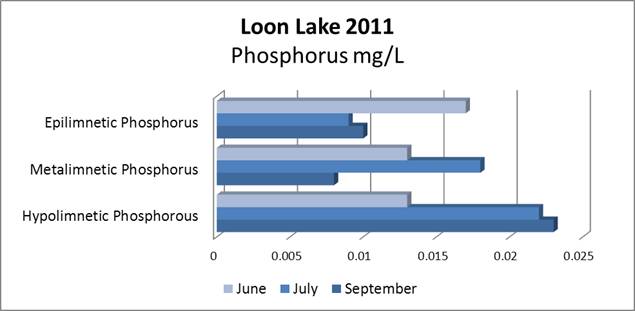
NUTRIENTS: Elevated phosphorus in the hypolimnion caused
by the summer’s decay of organic matter can be seen in Figure 4. Phosphorus gets remixed into the lake during
the fall. This fuels the next year’s
algae growth. Loon Lake Sewer District
#4 was formed to stop phosphorus from entering the lake. However it is important that remaining
sources of phosphorus are minimized.
These sources include; storm water from hardscape (roofs, driveways,
roads, etc.); fertilizer from landscaping and; remaining septic systems with
drain fields. It is also important to
provide shoreline vegetative buffers and maintain wetlands adjacent to the lake
in order to absorb nutrients (most importantly phosphorus) as they migrate
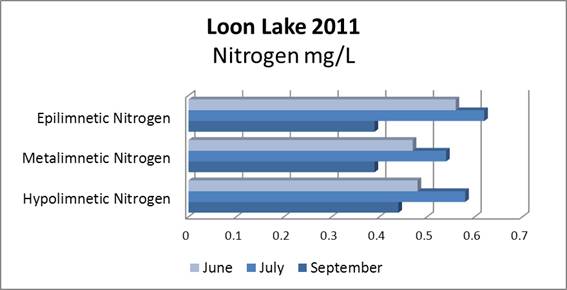
toward the lake. Nitrogen, although an
important polluting nutrient, is not nearly so dangerous to the lake
environment, especially without attendant high levels of phosphorus. All new development within the Loon Lake
drainage system (The Loon Lake Watershed) should be regulated in such a way so
as to retain wetlands in their natural state; minimize or prevent runoff;
prevent contamination of the aquifer from sewage systems through export of
effluent to a location outside the watershed as does Sewer District #4; and
protect uplands from inappropriate development so that the aquifer may continue
to be recharged by precipitation.
Figure
4: Loon Lake Phosphorus Levels by
Stratum
Figure
5: Loon Lake Nitrogen Levels by Stratum
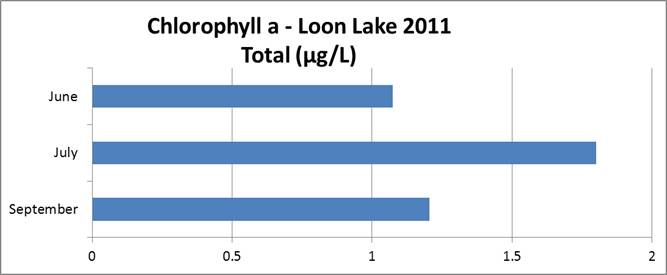
CHLOROPHYLL
a: Chlorophyll a sampling
is done on the surface using a Kemmerer Capture Bottle. Two 300 mL samples are blended from 100 mL
quantities collected at depths of 1, 3, and 5 meters. Sample bottles are wrapped in foil to protect
them from light, are kept in cold storage until delivered (within two hours)
to the Spokane Tribal Lab for analysis. Analysis results of the two samples are
averaged.
Figure
6: CHLOROPHYLL a